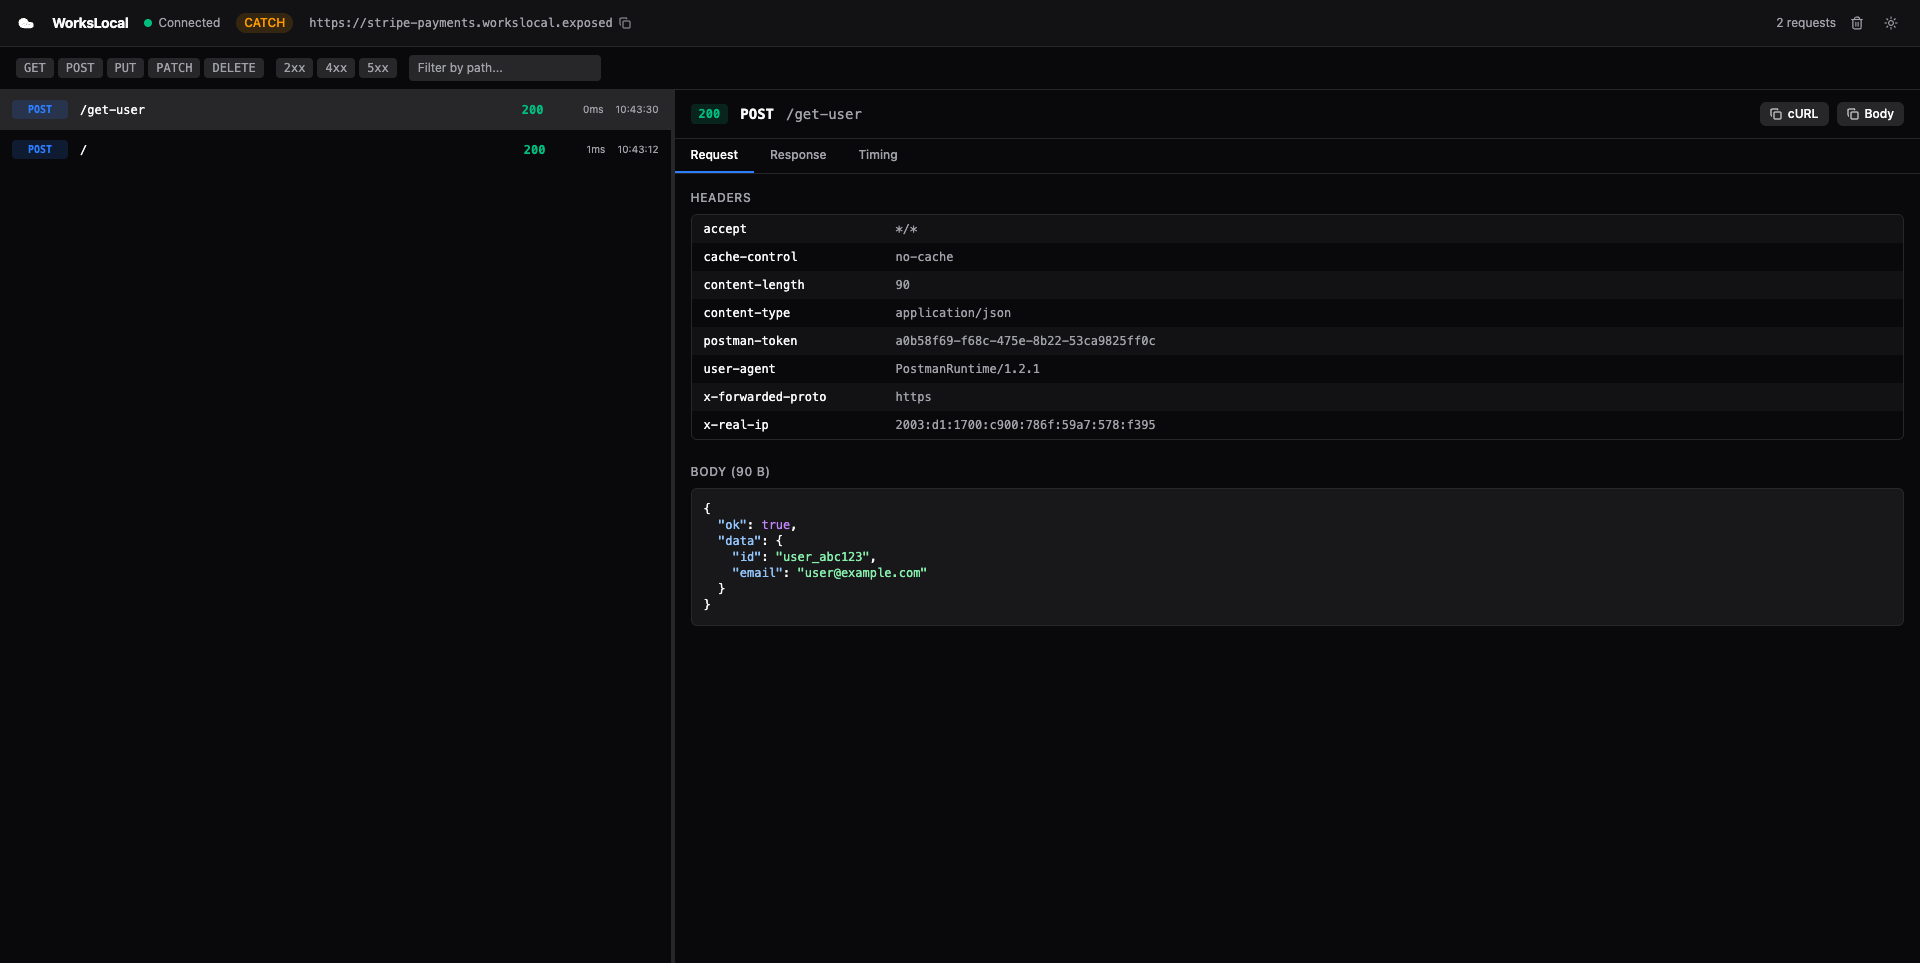
Web Inspector
A built-in request/response inspector served at localhost:4040. View every HTTP request flowing through your tunnel in real time — headers, body, query params, timing, and status codes.
Opening the inspector
The inspector starts automatically when you run a tunnel:
workslocal http 3000
# → Web inspector at http://localhost:4040
Open http://localhost:4040 in your browser. It works in both http and catch mode.
If port 4040 is already in use, the inspector silently skips — your tunnel still works. The CLI logs a warning:
⚠ Inspector port 4040 in use, inspector disabledWhat you see
The inspector is a dark-themed React SPA with a split-pane layout:
Left pane — Request list
A chronological list of every request that passed through the tunnel, newest first. Each entry shows:
- Status badge — colored by status code (green for 2xx, red for 5xx, yellow for 4xx)
- Method + path — e.g.,
POST /webhooks/stripe - Timestamp — when the request arrived
- Latency— round-trip time including your local server's processing time
Click any request to see its details in the right pane.
Right pane — Request detail
Three tabs for the selected request:
Headers tab
- Request headers (Host, User-Agent, Content-Type, Authorization, custom headers)
- Response headers
Payload tab
- Request body with automatic JSON formatting and syntax highlighting
- Raw body view for non-JSON payloads
- Query parameters parsed into key-value pairs
Response tab
- Status code with description (e.g.,
200 OK,404 Not Found) - Response body with JSON formatting
- Response time in milliseconds
Features
Live updates via SSE
The inspector uses Server-Sent Events (SSE) to receive new requests in real time. When a request flows through the tunnel, it appears in the inspector immediately — no polling, no refresh.
Copy as cURL
One-click copy of any request as a cURL command. Useful for:
- Replaying a webhook in your terminal
- Sharing a request with a teammate
- Debugging outside the inspector
Clear requests
Delete all captured requests from memory. Useful when you want a clean slate for testing.
Catch mode indicator
When running in catch mode (workslocal catch), the inspector shows a “CATCH” badge and the response includes an x-workslocal-mode: catch header. This makes it clear that requests are being captured, not forwarded.
How it works internally
The inspector is a lightweight HTTP server running inside the CLI process. It serves two things:
- Static files — the pre-built React SPA (from
@workslocal/inspectorpackage) - API endpoints — REST + SSE for the SPA to fetch and stream data
Architecture
Browser (localhost:4040)
  ↕ HTTP (fetch + SSE)
Inspector Server (Node.js http.createServer)
  ↕ reads from
RequestStore (in-memory ring buffer)
  ↕ written by
TunnelClient (on every request:complete event)
When a request flows through the tunnel:
TunnelClientreceiveshttp_requestfrom the relay via WebSocketLocalProxy(orCatchProxy) processes it and produces a response- The request + response pair is saved as a
CapturedRequestin theRequestStore - The
InspectorServerpushes the captured request to all connected SSE clients - The browser SPA receives the SSE event and adds the request to the list
RequestStore
The RequestStore is an in-memory ring buffer. Key properties:
- Max size: 1,000 entries per tunnel (configurable via
MAX_REQUESTS_PER_TUNNELin@workslocal/shared) - Eviction: when full, the oldest entry is removed (FIFO)
- Filtering: supports filtering by tunnel ID, HTTP method, and status code range
- Ordering: returns newest first by default
What gets captured
Every CapturedRequest contains:
| Field | Type | Description |
|---|---|---|
| requestId | string | Unique ID assigned by the relay |
| tunnelId | string | Which tunnel received this request |
| method | string | HTTP method (GET, POST, PUT, etc.) |
| path | string | Request path (e.g., /api/users) |
| query | Record<string, string> | Parsed query parameters |
| requestHeaders | Record<string, string> | All request headers |
| requestBody | string | Base64-encoded request body |
| responseStatusCode | number | HTTP status code from your server |
| responseHeaders | Record<string, string> | All response headers |
| responseBody | string | Base64-encoded response body |
| responseTimeMs | number | Round-trip time in milliseconds |
| timestamp | Date | When the request was received |
Inspector API endpoints
The inspector server exposes these endpoints at localhost:4040. You can use these from scripts, other tools, or AI agents.
GET /api/requests
Returns all captured requests, newest first.
curl http://localhost:4040/api/requests
[
  {
    "requestId": "req_abc123",
    "method": "POST",
    "path": "/webhooks/stripe",
    "responseStatusCode": 200,
    "responseTimeMs": 12,
    "timestamp": "2026-03-25T10:30:00.000Z",
    ...
  }
]
Supports filtering (planned):
?method=POST— filter by HTTP method?minStatus=400&maxStatus=599— filter by status code range
DELETE /api/requests
Clear all captured requests.
curl -X DELETE http://localhost:4040/api/requests
{ "ok": true }GET /api/tunnel
Returns metadata about the current tunnel.
curl http://localhost:4040/api/tunnel
{
  "mode": "http",
  "publicUrl": "https://myapp.workslocal.exposed",
  "subdomain": "myapp",
  "domain": "workslocal.exposed",
  "localPort": 3000,
  "isPersistent": false,
  "email": null
}
GET /api/events
Server-Sent Events stream. Pushes new requests in real time.
curl http://localhost:4040/api/events
data: {"type":"connected"}

data: {"requestId":"req_abc","method":"POST","path":"/webhooks/stripe","responseStatusCode":200,...}

data: {"requestId":"req_def","method":"GET","path":"/api/users","responseStatusCode":200,...}
Each data: line is a full CapturedRequest JSON object. The initial {"type":"connected"} message confirms the SSE connection is open.
CORS
All API endpoints include Access-Control-Allow-Origin: * headers. This means you can fetch from the inspector API from any origin — useful during development when the inspector SPA runs on a different port (e.g., Vite dev server on localhost:5173).
Limitations
- In-memory only — all captured requests are lost when the CLI exits. No persistence to disk. SQLite-backed persistence is planned.
- 1,000 request buffer — the ring buffer holds the last 1,000 requests. Older requests are evicted when the buffer is full.
- No request editing/replay — you can view requests but cannot modify and re-send them yet. Request replay is planned.
- No HAR export — exporting the request history as a HAR 1.2 file is planned.
- No WebSocket inspection — WebSocket frames are passed through but not captured in the inspector. Only HTTP request/response pairs are shown.
- Fixed port 4040— the inspector always tries port 4040. If it's in use, the inspector is silently disabled. Configurable port via
--inspect-portis planned. - No filters in UI — method toggles, status range filters, and path search are planned but not yet in the current inspector build.
- Base64 bodies — request and response bodies are stored as base64. Large binary bodies (images, files) consume proportionally more memory.
- Single browser tab — opening multiple inspector tabs works (each gets its own SSE connection) but all show the same data.
Tips
Use with catch mode
The inspector is most powerful when combined with catch mode. You can see exactly what a webhook provider sends without writing any handler code:
workslocal catch --name stripe
# Open localhost:4040
# Trigger a test event in Stripe dashboard
# See the full payload in the inspector
Use the API for scripting
The inspector API at localhost:4040/api/requests is a JSON endpoint. You can pipe it into jq for quick analysis:
# Get the last request body decoded from base64
curl -s http://localhost:4040/api/requests | jq '.[0].requestBody' -r | base64 -d | jq .

# Count requests by status code
curl -s http://localhost:4040/api/requests | jq 'group_by(.responseStatusCode) | map({status: .[0].responseStatusCode, count: length})'
Combine with --json
When running the tunnel with --json, the CLI outputs machine-readable JSON while the inspector provides the visual UI. Both work simultaneously.